 Beyond Coordinates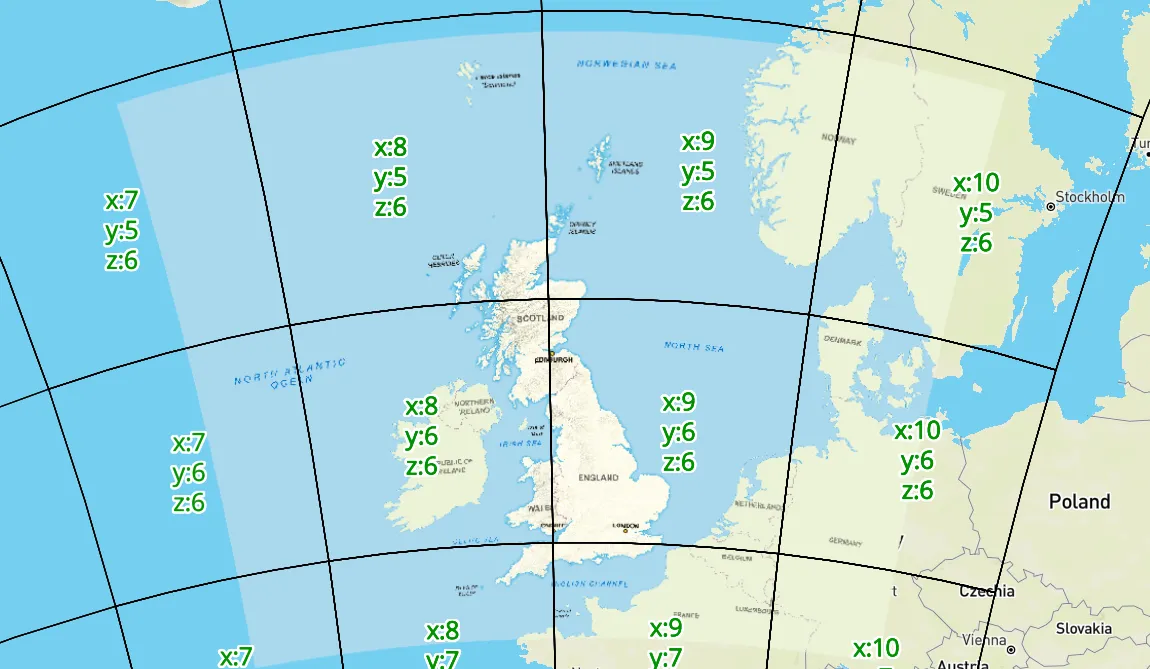
Most publicly available raster tiles use Web Mercator, while a smaller number use a geographic longitude–latitude grid. Both schemes are straightforward and support global coverage. Local and regional applications, however, may encounter less common projections. MapTiler, for example, provides raster tiles in national coordinate reference systems for the Czech Republic, the Netherlands, Switzerland, and other countries.
A common requirement is to overlay raster tiles from different projected coordinate systems.
Available Approaches
MapProxy
MapProxy is usually the first choice for this problem. A server acts as a proxy that caches, accelerates, and transforms map services. The diagram below summarizes its capabilities.

In some environments, however, introducing a server is impractical. That constraint motivates the client-side solution described here.
OpenLayers
OpenLayers provides one of the most comprehensive client-side GIS toolkits, including the following reprojection example.
This article reuses some of that example’s data sources and CRS definitions. Server-side reprojection generally provides the best rendering quality and loading efficiency, while a browser-based approach offers greater deployment flexibility.
Implementation
Reprojecting raster tiles in Mapbox requires solving three problems:
- Determining which raster tiles are needed for an arbitrary camera view
- Mapping the scale denominators of the source tile matrix set to Mapbox zoom levels
- Reprojecting each source tile into Web Mercator
The first problem is tile selection under arbitrary camera pitch and bearing. Mapbox’s undocumented CustomSource interface can handle it. A developer implements a class with a loadTile method, creating a custom source that behaves much like a raster source. See source/custom_source.js in the source tree. A minimal example follows:
class CustomSource {
    constructor() {
        this.id = 'custom-source';
        this.type = 'custom';
        this.tileSize = 256;
        this.tilesUrl = 'https://stamen-tiles.a.ssl.fastly.net/watercolor/{z}/{x}/{y}.jpg';
        this.attribution = 'Map tiles by Stamen Design, under CC BY 3.0';
    }

    async loadTile(tile, {signal}) {
        const url = this.tilesUrl
            .replace('{z}', String(tile.z))
            .replace('{x}', String(tile.x))
            .replace('{y}', String(tile.y));

        const response = await fetch(url, {signal});
        const data = await response.arrayBuffer();

        const blob = new window.Blob([new Uint8Array(data)], {type: 'image/png'});
        const imageBitmap = await window.createImageBitmap(blob);

        return imageBitmap;
    }
}

map.on('load', () => {
    map.addSource('custom-source', new CustomSource());
    map.addLayer({
        id: 'layer',
        type: 'raster',
        source: 'custom-source'
    });
});
CustomSource tells the implementation which destination tiles Mapbox needs, avoiding a separate visibility calculation—especially under map pitch and rotation—and providing a convenient Web Mercator tile grid for caching.
The second problem is zoom mapping. WMTS tile-matrix levels do not necessarily correspond to Web Mercator zoom levels. A simple approach is to compare every WMTS level with every destination zoom. As explained in What is WMTS’ ScaleDenominator?, WMTS assumes a nominal pixel size of 0.28 mm. Mapbox’s transform object can provide pixels per meter at each zoom level. Comparing these values establishes the mapping between the two level systems.
The final problem is reprojecting each tile into Web Mercator. Transformation between projected CRSs is nonlinear, so stretching a single quadrilateral defined by the tile’s four corners is insufficient. The surface must be subdivided. The images below show one, two, three, and four subdivisions. Reprojecting EPSG:27700 to Web Mercator produces a visibly fan-shaped footprint.
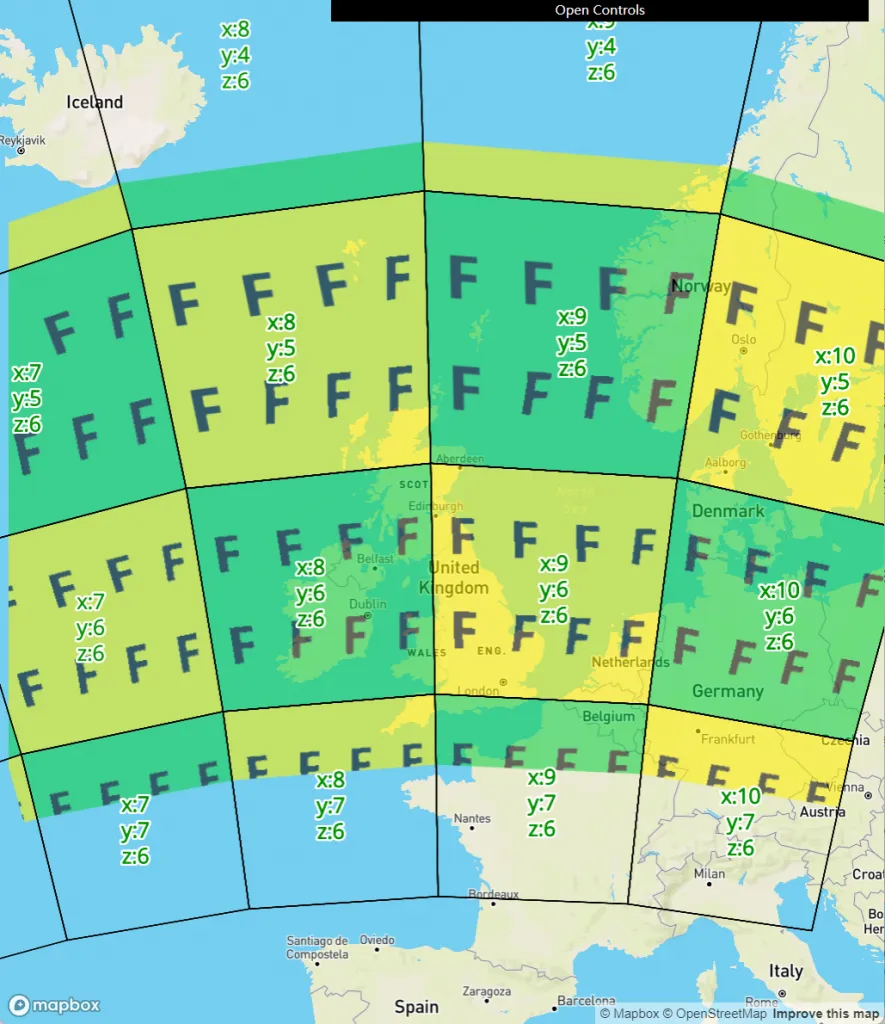
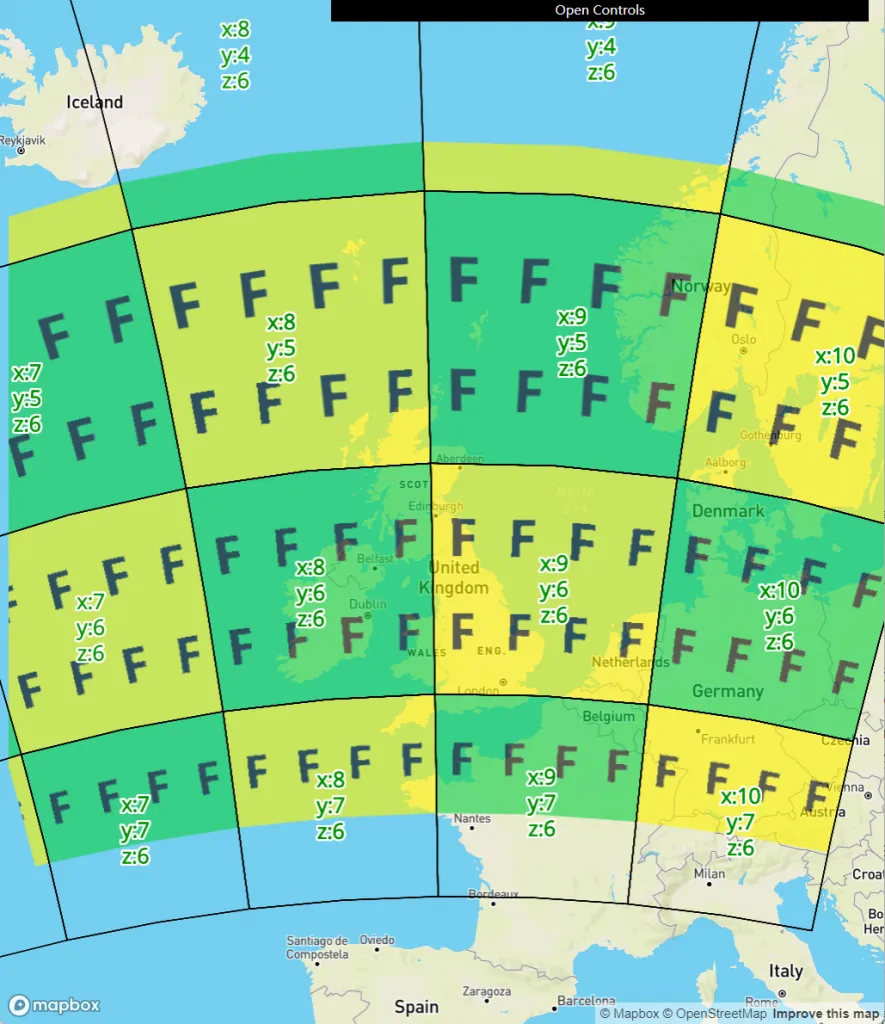
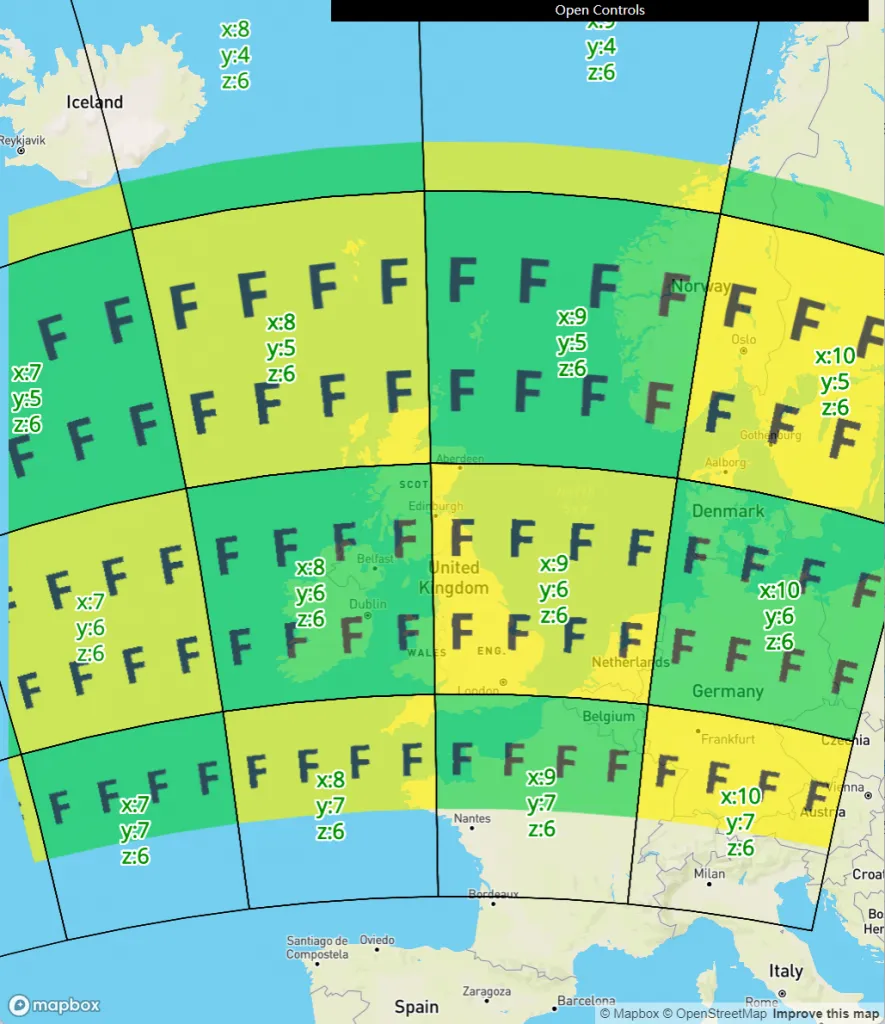
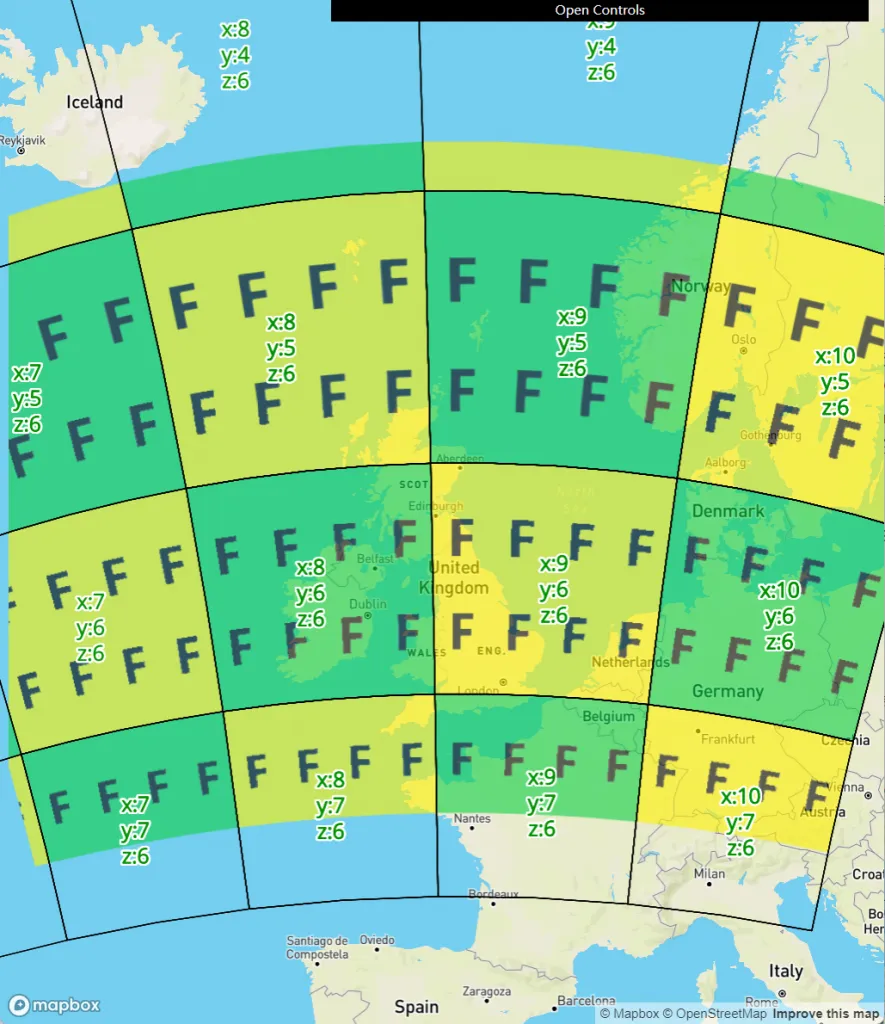
This is expected: Web Mercator increasingly exaggerates scale toward the poles, while a local projection is designed to control distortion within its area of use.
Removing Tile Seams
After solving the preceding problems, the reprojected tiles can be overlaid on the Web Mercator map. Obvious seams remain along source-tile boundaries, however, because resampling a warped image cannot obtain suitable neighboring pixel values at its edges.
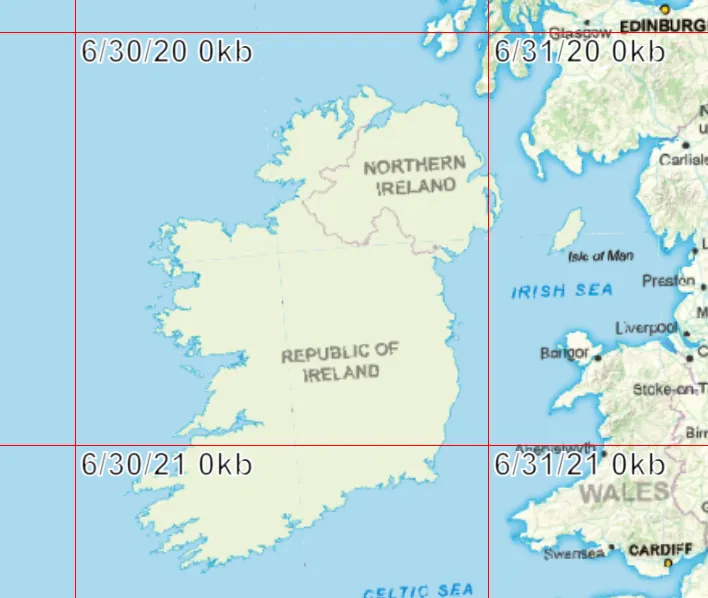
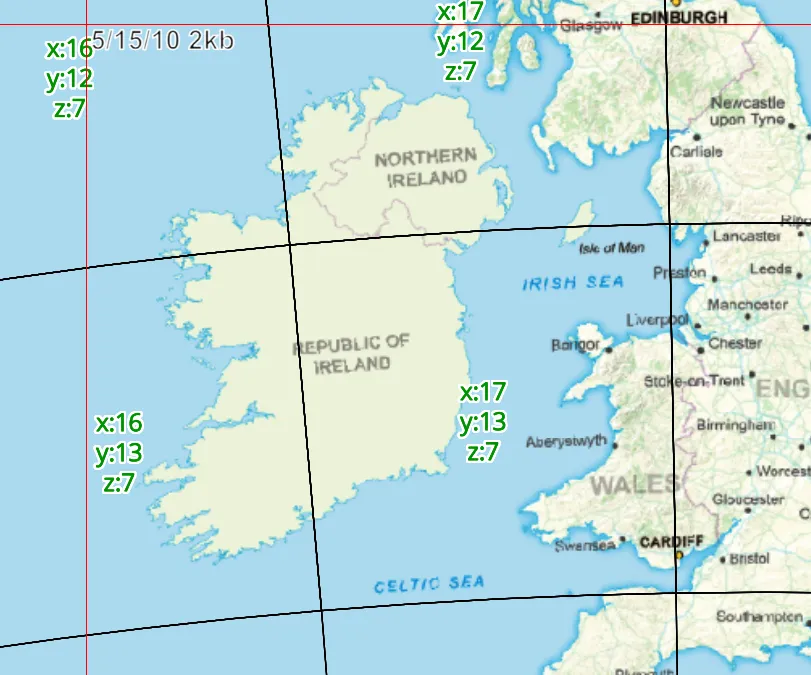
As noted in The Lifecycle of a Mapbox Vector Tile, Mapbox adds a one-pixel border when processing raster data to avoid flickering at tile edges. Here, a simpler approximation adjusts the calculated UV coordinates inward by one pixel. Texture sampling at the warped tile edge can then use valid colors.
// draw_tile.js
for (let i = 0; i < uv.length; i++) {
    uv[i] = uv[i] * ((width - 2) / width) + 1 / width;
}
This sacrifices one row or column of pixels, which remains visible under close inspection. Reproducing Mapbox’s full solution would require preprocessing in a Web Worker; performing that work directly on the main thread would have a substantial performance cost.