 Beyond Coordinates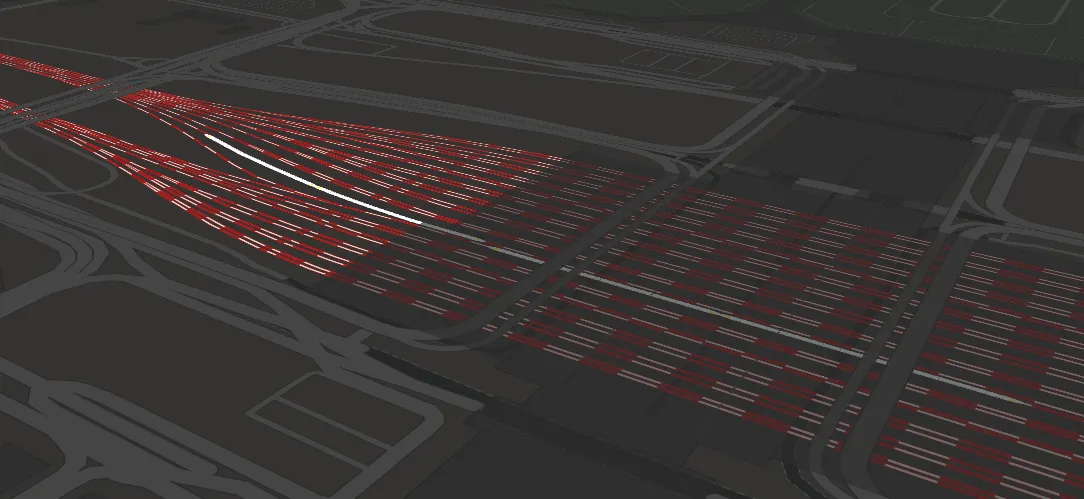
By the time I finished this small train-operation visualization, I could no longer remember exactly why I had started it—probably simply because it seemed fun. The final version omits several ideas from the original design, mostly because some data was unavailable and some features were too complex to implement.
Although I generally dislike background music on web pages, I wanted to pair this project with the music from the “Japan” chapter of the game Train Valley.
Interactive Demo
Use the control in the upper-left corner to pause or resume the animation. The sample contains a subset of trains running between 6:00 p.m. and 6:40 p.m. Use the control in the upper-right corner of the map to enter fullscreen mode.
Data
Most of the data was collected from third-party railway-ticketing platforms, where it had already been organized into a convenient form.
Some information was unavailable, including the number of cars in each train. I therefore assumed 16 cars, even though actual trainsets can be shorter or longer—for example, a long-formation Fuxing EMU can have 17 cars.
Most services terminating at Shanghai Hongqiao had no platform information and could not be visualized. For some trains, the arrival platform may be assigned shortly before arrival, which would explain why the API could not provide it in advance.
Implementation
Railway-themed Map
The dark basemap removes features unrelated to railways and emphasizes the tracks. OpenStreetMap’s coverage is remarkably complete: all 30 platforms at Hongqiao are mapped accurately, and the track junctions are detailed enough to support route planning for the trains.
The approaches on both the north and south sides of the station are also well mapped, including the tracks connecting Hongqiao with Shanghai South and Shanghai railway stations. I initially planned to visualize trains at all three stations, but at the smaller map scale the trains, tracks, and platforms became difficult to read.
The final visualization therefore covers Shanghai Hongqiao and the tracks within six kilometers of arriving at or departing from the station.
Train Model
The model represents each train as two coupled eight-car units. I am not certain whether that formation is accurate for every service.

Each train consists of 16 car objects with the following properties:
- Position: longitude and latitude
- Rotation: the car’s angle relative to true north
- Type: head, body, or tail
static buildGeoJSON(coord, train_index, train_type, angle) {
    var singe_type = "body";

    if (train_type === "\u52a8\u8f66\u7ec4" && (train_index===0 || train_index===8)) {
        singe_type = "normal_head";
    }
    else if (train_type === "\u52a8\u8f66\u7ec4" && (train_index===7 || train_index===15)) {
        singe_type = "normal_tail";
    }
    else if (train_type === "\u9ad8\u901f\u94c1\u8def" && (train_index===0 || train_index===8)) {
        singe_type = "high_head";
    }
    else if (train_type === "\u9ad8\u901f\u94c1\u8def" && (train_index===7 || train_index===15)) {
        singe_type = "high_tail";
    }

    return {
        "type": "Feature",
        "geometry": {
            "type": "Point",
            "coordinates": coord
        },
        "properties": {
            "train_type": singe_type,
            "icon_rotate": angle
        }
    };
}
These three properties are sufficient to render a frame like the screenshot above. The following section explains how they are calculated.
Calculating Train State
Calculating train state took most of the development time, and controlling simulated time also required some effort.
The first questions are whether a train has left the platform and how far it has traveled. To produce smooth motion, the demo models each train with constant acceleration, using a default of . Because the visible area is small, acceleration remains constant throughout the route; there is no need to model a maximum speed followed by constant-velocity travel.
The next requirement is an operation similar to Turf’s along. It must run 16 times for each train, so I implemented a specialized version for efficiency.
Given the distance traveled, the algorithm derives the front and rear coordinates of each car, then calculates its center coordinate and rotation. Those values produce the final visualization.
// Calculate the coordinates at the front and rear of each car.
for(var i=this.route_path_coords.length-1; i > 0; i--) {
    var coord1 = this.route_path_coords[i];
    var coord2 = this.route_path_coords[i-1];
    var tmp_distance = Train.calDistanceInM(coord1[0], coord1[1], coord2[0], coord2[1]);
    if(tmp_distance < passed_distance) {
        passed_distance -= tmp_distance;
    }
    else {
        result_coords.push(Train.getLocationByDistance(coord1, coord2, passed_distance/tmp_distance));
        if (train_index > 0) {
            train_index -= 1;
            passed_distance += Train.single_length;
            i += 1;
        }
    }

    if (train_index === 0) {
        break;
    }
}

// Calculate the center coordinate and rotation of each car.
for (var k=0; k<result_coords.length-1; k++) {
    var coord1 = result_coords[k];
    var coord2 = result_coords[k+1];
    var center = [(coord1[0]+coord2[0])/2, (coord1[1]+coord2[1])/2];
    var angle = Train.calAngle(coord1[0], coord1[1], coord2[0], coord2[1]);

    results.push(Train.buildGeoJSON(center, k, this.train_type, angle));
}